
In an age devoid of modern communications methods and digital maps, military generals often made tactical decisions based on what they could see with their own eyes. In studying the Battle of Gettysburg, many people have wondered if General Lee’s limited perspective could have been the deciding factor in his defeat. And with today’s advanced computer analysis tools, it would seem like a simple matter to figure out exactly what Lee could have seen on those fateful days in early July 1863.
But it isn’t as simple as firing up ArcGIS and running a viewshed analysis of the Lutheran Seminary, Robert’s rumored vantage point on the second day of the battle. In this month’s Out of Place, we take a quick look at Ann Kelly Knowles‘ essay, “What Could Lee See at Gettysburg?”
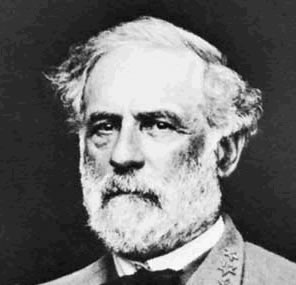
“All this has been my fault.”
— General Robert E. Lee to his retreating troops after the defeat at Gettysburg
Arguably the pivotal battle in the American Civil War, the Battle of Gettysburg has been heavily scrutinized for generations. Investigations began within days after the battle, and the “topogs” (topographical engineers) of the day were at the forefront. They produced some astonishing maps of the area. For example, the Manuscript Map produced in 1868-1869 is an incredibly-detailed 1:2,400 scale with 4′ contour intervals (a slightly larger version is online in the David Rumsey Map Collection).
But no such detailed map existed at the time of the battle. In fact the poor maps of the Eastern states that did exist were so dismal that generals from both sides chose mostly to rely on oral reports instead. That, and what they could see.
While General Lee may not have had a good map, he sure knew how to ‘read’ the terrain. Both Lee and his adversary, General Meade, had learned topographical mapping and engineering at West Point. As a Captain, Lee had led the U.S. military survey of Mexico City and the surrounding area during the Mexican-American war. Lee “seemed to understand the ground at a glance.”
In an effort to virtually derive such a glance, Anne Kelly Knowles and her team used a 1996 digital elevation model (DEM) and an interpolated five foot contour interval line set to generate a TIN (triangulated irregular network) from the contours using GIS. But, like I said earlier, gleaning that glance of understanding isn’t so simple:
Like any human-made representation of the earth’s surface, our TIN of the Gettysburg battlefield distorts reality. The actual physical surface of the earth is not made of flat triangles. The TIN is bald of vegetation, whereas the battlefield was covered by various kinds of plants, from waist-high wheat to sixty-foot conifers. The TIN takes no account of diminished visibility at dawn or dusk, nor cloud-cover, nor the smoke of battle. It is a mathematical model, an abstraction generated from contours, which themselves were created by people using photogrammetric methods to interpolate continuous lines of elevation from spot heights and control points drawn on aerial photographs. In other words, the digital terrain is a highly reconstructed, simplified representation of reality. Its chief virtue is its comprehensiveness. It provides what Civil War commanders did not have: a synoptic view of a large area.
That view also included new additions to the landscape since the battle, such as a quarry, a reservoir, and a highway. In order to come up with a view that better represented the shape of the battlefield’s historical landscape, the team created a second TIN from the larger version of the Manuscript field map we mentioned earlier. This too was not without its challenges:
Extracting contours from the Corps of Engineers map to use them in GIS analysis proved a daunting task. No scanning program could distinguish between the contour lines and the various lines and shapes representing fences, trees, boulders, and houses. The extraction process began with manual tracing of the four-foot contours from a good photocopy of a proof sheet of the engraved 1:12,000 map, using a light table, drafting pens, and Mylar sheets. While most of the map was traced at its original size, the steepest hills (Wolf Hill, Culp’s Hill, Little Round Top, and Big Round Top) were enlarged to trace their tight contours. We scanned the Mylar tracings at high resolution, then used a program called ArcScan to separate lines that touched in steep areas and to ensure that lines had not been dropped during tracing and that contour lines connected across stream beds. Once the hills were patched in, each line was assigned elevation as recorded on the original map. The final step was the easy part: using GIS to generate a TIN from the final contours.
In order for GIS software to display the historical and modern layers in the same view, control points (such as small buildings and road intersections that existed in both maps) were added to the contour tracing. Using orthophotos (aerial photos that have been georectified) of farmsteads preserved since the battle, the historical contours could be assigned the same projection as the 1996 data. Now both TINs could be overlaid for visual comparison.
Alignment of hilltops and ridgelines were pretty tight (less than 50 feet displacement), but creek beds in some locations differed by hundreds of feet. Overall, though, the two generated viewsheds were remarkably similar:
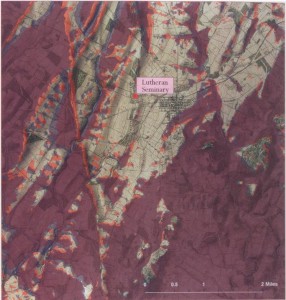
[Viewsheds from the top of the Lutheran Seminary cupola; 1996 data in red, historical data in dark blue. Unshaded areas are visible from the viewpoint.]
You can see right away the significant differences on the western half of the map. Some of this could be due to the manual tracing of the contours and manipulation of the resulting data. Or perhaps the surveying and drawing of the historical map varied in quality depending on the location. At any rate, the viewsheds were close enough for the team to decide that using the historical data would be accurate enough. Time to add in the Union line:
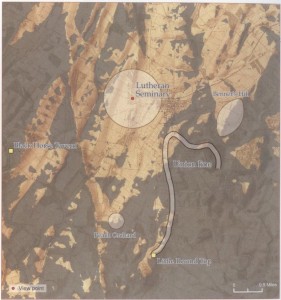
The pale white ovals indicate areas historians say Lee could have seen from the Seminary cupola, about 75 feet from the ground. Based on viewshed analysis, however, Lee could very well have seen a great deal more. But even without adding in a vegetation layer to account for the woodlands that would have significantly obstructed his line of sight, it is quite apparent that he could not see the area southeast of the union line which is precisely where the Union army was massing and which the following day would make short work of the famous “Pickett’s Charge.”
Due to my creation of the WikiWar project, I was very glad that Anne Kelly Knowles acknowledged her intimate awareness of the imprecision of the data she had to work with. And yet, she recognizes that similar geographical analysis applied to other wars and battlefields could provide “many valuable insights into military strategy, the wisdom of command decisions, and the experience of war.”
Of course, you could always take the curmudgeon view instead:
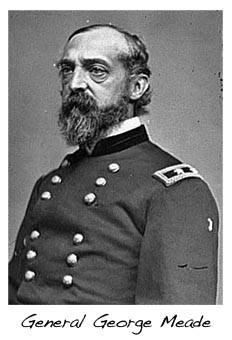
“I don’t believe the truth will ever be known, and I have a great contempt for history.”
— Gen. George Meade, Victorious General of the Battle of Gettysburg
See you next month 😉


Be the first to comment